Horton Bay is fairly sheltered and doesn't have much current. Or so I thought before I started making measurements at a speed of around 1 knot. I ended up making two passes at varying motor currents, and then a third pass at a constant motor current (and hence constant speed through the water). In priniciple I should have been able to calculate the tidal current at all points from the GPS log, and then substract that to calculate speed through water instead of speed over ground.
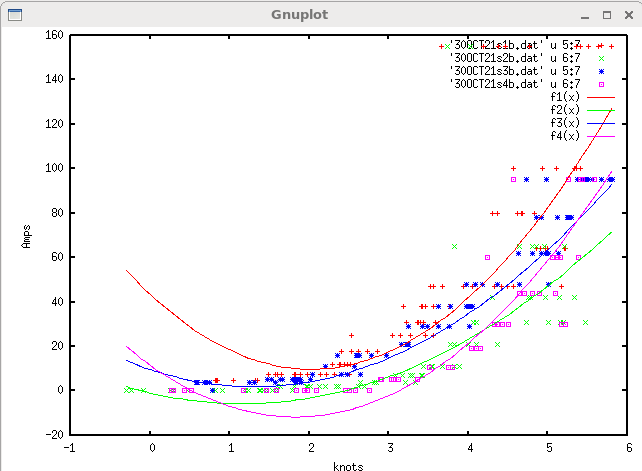
In practice, it seemed I had not sailed the exact same track through the narrows and so the current profile was slightly different. This meant that the power curve calculated for my 4 passes (2 northbound and 2 southbound) is slightly different.
I'll have to repeat the experiment in open water, probably next year in more clement weather. Meanwhile, all I can say is that the power is roughly proportional to the square of speed.
The f(x) curves are a mathematical fit to the data points.
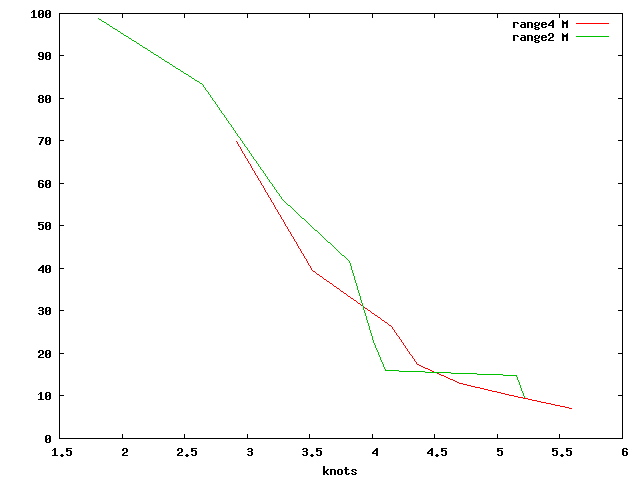
This is the calculated range under electric power at different speeds. I don't trust the numbers.